
MS EnvIM
Chinese coastline: Unveiling New Resources Through Marine Innovations in China
Introduction
Chinese Coastline: Unveiling New Resources through Marine Innovations in China
Since the creation of Special Economic Zones in the 1980s that attracted huge investment flows in China, Chinese coastal provinces have played a major role in the national economy. They accounted for 65% of the country’s GDP in 2009. In the meantime, China faces a huge demographic pressure, especially on the coastline where today 40% of the national population is gathering. In these regions, this human pressure causes an increasing stress regarding natural resources and notably freshwater, food and energy supply.
All around the world, coastlines are amongst the most vulnerable areas. These fragile natural ecosystems are threatened by anthropogenic activities. They are also particularly exposed to climate change consequences having to cope with: extreme weather events, sea-level rises, seawater seepages, accelerated erosion and drastic coral reefs depletion, to name a few.
On the other hand, coastal zones offer plenty of resources and could be considered as strategic areas. China possesses 14.500 kilometers of coast through its access to 4 different seas. From the perspective of policies, China has made great steps to make full use of seawater. From 2006 to 2010, China has set a “Special Plan for Seawater Utilization” as a blueprint of medium and long term use of seawater resources. In 2013, the use of seawater resources has been included in the national and provincial plans in terms of circular economy, energy saving and environmental protection as well as the ocean economy. Related contents can be found in the “Guidelines on Accelerating the Development of Energy Saving and Environmental Protection Industries” and in the “12th Five-year Plan on National Ocean Industry Development” by the Chinese State Council. There are also policies and guidelines on provincial level in Zhejiang, Hebei and Shandong provinces.
Thereby, for China, the coastline becomes an opportunity. EnvIM students, through the study of existing scientific research and development projects in China, tried to show how blue technologies could unveil new resources for China through marine innovations.

1. Marine Renewable Energies
Mostly based on fossil energies, the Chinese energy mix is for now responsible for tremendous greenhouse gases emissions and China wide a poor air quality. Marine Renewable Energies (MREs) could be a good alternative to switch to a cleaner energy production system. Since 40% of the Chinese population and 60% of Chinese GDP is concentrated on coasts, increasing renewable energy production especially in these zones is relevant and could also be particularly economically profitable. Indeed, other fossil resources such as coal - which as can be seen in the figure 1 represents most of China’s energy source - are transported from central and eastern regions while MREs would provide a locally produced energy.
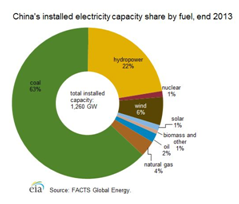
Figure 1 China's installed electricity capacity share by fuel, end 2013

China is bordered by four different seas, the Yellow Sea, the South China Sea, the East China Sea and the Bohai Bay. Along such a large coast, the production of marine renewable energies could significantly be developed. According to the State Oceanic Administration (SOA), “China has an estimated marine energy reserve of more than 1.58 billion kilowatt-hours, with the potential to harness 650 million kilowatt-hours”. Besides, still according to the SOA, “90% of these resources are distributed along the coastal of the conventional energy shorted east China regions such as Shanghai, Zhejiang and Fujian”.
Such an opportunity did not stay unnoticed by the Chinese government which has been implementing various MREs development policies in order to spur their development. In the table below, some particularly relevant MREs development policies are listed.

MREs development policies and their publishing institutions
Wave energy, tidal energy, tidal currents, salinity gradient … many kinds of MREs, relying on various ocean functions and implemented through different systems, exist. However in this article, three specific MREs were chosen for their novelty and maturity in China and were focused on. Indeed, not only have tidal current energy, wave energy and thermal energy passed the experimental stage in China but they are also recent and innovative.
1.1. Wave energy
Short presentation of wave energy technology
In this technology the kinetic energy of waves is used to produce electricity. It is known to be highly variable because waves are created by the wind passing over the ocean which is non-predictable at wave-scale. To harvest wind energy, several kinds of technologies exist: the oscillating water column, the pendulum energy converter, the oscillating buoy and the Salter’s duck (1).
Examples of the three latter technologies only will be presented here, the oscillating water column having been proven inefficient, costly and instable in China (2), notably because of its low energy conversion rate.
Development status in China: examples of wave energy production installations
Pendulum energy converter
These pendulums moving back and forth with the waves have been installed in Daguan Island, in the Shandong province, off the East Coast of North China. The onshore pendulum on the picture left possesses an of 30 kW and can Two more offshore pendulums, possessing a wave energy conversion rate of 16%, are installed and deliver an installed capacity of 50 kW each.

The oscillating buoy: an Ecowave Power device
Fixed on existing structures and oscillating with the waves, this onshore oscillating buoy pumps fresh water that drives a turbine. The device constructed by EcoWave Power in Zoushan Island in Zhejiang Province possesses an installed capacity of 100 kW.
The video below shows EcoWave Power's medium-Scale energy harvesting installation that was being tested in the Black Sea in 2011.
Salter’s duck
Salter’s ducks are fixed to the sea bed in rows. These buoys, represented on the picture below, oscillate with the waves, causing the pendulums or gyroscopes inside to move back and forth therefore creating hydraulic energy that is then transferred to a turbine or a generator. Salter’s ducks are amongst the best wave technologies so far, with an observed conversion rate of about 60%. Three devices with installed capacities of respectively 10 kW, 10 kW and 100 kW are being tested on Wanshan Island, off shore Macau, in the South of China, in Guangdong province (3).“Salter’s ducks” are buoy attached to the sea bed in rows. They oscillate with the waves, causing pendulum/gyroscopes inside to move back and forth and creating hydraulic energy that is transferred to a turbine or generator. It is one of the best technologies so far, with an observed conversion rate of 60%. Two 10 kW and one 100 kW devices have been tested on Wanshan Island, Guangdong province (Xia, Governmental Initiatives and Relevant projects on Ocean Energy in China, 2014).
Pros and cons of wave energy technology:

Sources
-
An overview of ocean renewable energy in China. Wang, Shujie, et al., et al. s.l. : Elsevier, 2011, Renewable and Sustainable Energy Reviews, pp. 91-111.
-
Lund, Per Christen. Energy from Wind and Ocean, A North-East Asia Market Study. Tokyo : Innovation Norway, 2010.
-
Governmental Initiatives and Relevant projects on Ocean Energy in China. Xia, Dengwen. Halifax : National Ocean Technology Center, 2014. International Conference on Ocean Energy.
-
Marine renewable energy in China: current status and perspectives. Zhang, Yong-Liang, Lin, Zheng and Liu, Qiu-Lin. 2014, Water Science and Engeneering.
-
You, Yage, et al., et al. Wave energy technology in China. Guangzhou Institute of Energy Conversion. Beijing : Royal Society Publishing, 2012. pp. 472–480, Review.
-
Xia, Dengwen. Annual Report for China. s.l. : National Ocean Technology Centre, 2014.
-
http://www.chinadaily.com.cn/china/2015-05/28/content_20847720.htm
-
Wang, S., Yuan, P., Li, D., & Jiao, Y. (2011). An overview of ocean renewable energy in China. Renewable and Sustainable Energy Reviews, 91-111.
-
Xia, Governmental Initiatives and Relevant projects on Ocean Energy in China, 2014
-
http://tidalenergytoday.com/2015/03/26/eco-wave-power-gets-consent-for-wave-plant-in-china/
1.2. Tidal Current Energy
Tidal Current Energy uses the kinetic energy of currents in water channels created by ocean tides. In comparison to “classic” tidal energy which uses a dam structure to produce energy, tidal current energy is produced using turbines. Infrastructure-wise, the latter is therefore less demanding in resources and space and more flexible in its utilization. It is notably easier to put in place in any location desired. This article will present the basic principles of tidal current energy and while looking at the state of the art in China will discuss the pros and cons of tidal technology.
Tides and Tidal Current Energy: how does it work?
Tides are produced by the gravitational force applied by the moon on Earth. During a day Earth rotates around its axis making it so that the force applied by the moon on a specific water body is not always the same strength. The closer the moon is to the water body, the higher will this water body be. Therefore in a day, a cycle will occur with the water going up and down following the intensity of the force applied by the moon creating water currents.
The rotation of the moon around the earth and its position compared to the sun which applies a gravitational force of smaller influence on the water bodies will cause the intensity of the movement of the water body to vary during the year resulting in varying tide levels. The tide cycles are illustrated on the following animation.
Conclusion
Overall, wave power shows potential that could be exploited in China. Though, its costs remain the main hindrance to a more important development of this technology. At a commercial scale, the development of the technology could occur faster and come along with a decrease in the cost of the devices .Wave technology could thereby become an exploitable, cost-competitive and greener source of energy. However, wave energy stays a solution particularly relevant for islands’ inhabitants to whom it provides a direct access to energy and an alternative to hardly accessible fossil fuels.
(By Lookang many thanks to author of original simulation = Todd Timberlake author of Easy Java Simulation = Francisco Esquembre - Own work, CC BY-SA 4.0, https://commons.wikimedia.org/w/index.php?curid=38736531)
Tidal Current Energy is collected by inserting a turbine into a current of water created by a tide. The water will go through the turbine making it turn. As it turns it activates a hydraulic motor that in turn produces electricity.
Here is a video explaining the principle of tides and tidal turbines.
Many kinds of turbines exist; several look alike wind turbine as the three most common ones presented in the animation below.
The amount of energy harvested depends on the water velocity of the current. The minimum water flow requirement for the functioning of most turbines is of about 0.5 m/s but the fastest the currents the more energy can be drawn out of installed devices (2). In China notably, a large amount of currents holds potential for operating tidal current turbines.

Resources Available in China and Projects in Place
China has a very long coast and a high demand for energy. Tidal Current energy is renewable and could offer a solution for the production of more and greener energy in China.
Taking into account channels with water velocities above 0.5 m/s, a total amount of 13.95 GW of tidal current energy was estimated available coming from 130 Chinese channels. Considering the number of channels available and their respective water velocities in every region, the energy available is considered to be distributed as displayed on the map below :
As indicated by the blue cross on the previous map, most tidal resources are located in Zhejiang province – southeastern cost- which possesses many channels and particularly high water velocities. All of the currently built projects are installed there (3).
Four small scale projects are currently built on the Chinese coast amongst which the most significant is the Haineng I project. Set up in 2013, it displays two turbines of 150 kW installed power. Two other tidal current installations are currently in development and will display 2 to 4 turbines of 300 kW installed capacity each (3) (4).
In the world, a few projects are already working. The most significant of all is the SeaGen project in Ireland. This vertical axis turbine provides an installed power of 1.2 MW. In 2008, the year of its installation, it generated over 8GWh of electricity.

(http://www.seageneration.co.uk/index.php)
Limits of Tidal Current Energy
Even though tidal current energy offers an alternative and greener solution to fossil based energy, it currently faces limits that are to be researched about for this technology to be further developed.
First, the amount of energy produced by one single turbine is limited. While the energy potential of other technologies - as for instance thermal power plants which possess installations with installed powers of 10MW - the big project SeaGen reaches only a 10th of it (5). Therefore, turbine fences or arrays, who display dozens of turbines in a row, would be needed to scale up the installations and multiply the amount of energy produced. While installing fences or arrays, the hydrodynamic interactions might hinder the operation and efficiency of the turbines. They will therefore need to be studied further (5).
Also, tidal current turbines are submitted to tough conditions. Corrosion, fouling, blade failure or installation damage due to intense weather events are to be expected. Maintenance will be needed throughout the life of these devices and the maintenance operations and cost have to be thought of in advance.
To finish with, the cost of the electricity produced from tidal current turbines remains high. Notably in China, it is 3.5 times higher than the cost of the current electricity mix. In fact, the narrow development of such a technology and its limited commercialization increase the cost. The development of this market in China could be seen as an opportunity for employment, to decrease turbine prices, and to lead the global market.
Conclusion
Tidal Current energy is an energy with a promising potential. In many places in the world, tidal currents are sufficient to produce energy. In china for instance, 14 GW would be available. The development of tidal current installations is on its way. The cost of such energy remains high but should be seen as a complement to other energy mixes, especially relevant for remote places as islands possessing a high coast to land ratio.
Tidal current energy is a good occasion to make electricity mixes less carbon emitting and therefore less environmentally impacting. Though, marine ecosystems are put at risk by installing alien bodies in their environment. Destruction of sea beds, noise, collisions … The marine and biodiversity impacts tidal current turbines imply are also a main issue to be taken into account and researched about when such projects are created. See here for environmental impacts (link to other sheet)
Sources
-
Tidal power UK. http://tidalpower.co.uk/tidal-stream-generator.
-
An overview of development of tidal current in China: energy resource, conversion technology and opportunities. Li, D, Wang, S and Yuan, P. 2010.
-
Marine Renewable Energies in China: Current status and perspectives. Zhang, Yong-liang, Lin, Zheng and Liu, Qiu-lin. 2014.
-
Ocean energy systems. http://www.ocean-energy-systems.org/ocean-energy-in-the-world/china/.
-
The development of a vertical axis turbine. Brinck, Daniel and Jeremejeff, Nicklas. 2013.
-
Wikipedia.
-
A review on the development of tidal current energy in China.H . Liu, HW, et al., et al. 2011
1.3. OTEC: Ocean thermal energy conversion
Heat pumping is an already well-known technique to cool down or heat buildings. Heat pumps use electricity to circulate hot or cold air and respectively cool down or heat the place of interest. As a result the circulating hot air turns into cold air and inversely. An Ocean Thermal Energy Conversion plant (OTEC) exploits the same kind of principle but in a reversed way. It uses two water sources with different temperature to produce electricity.
This article will present the principle of OTEC and will take interest in available resources over the world and particularly in the Hainan OTEC project in China before concluding on some perspectives and limits inherent to this technology.
Operational insights on OTEC technology
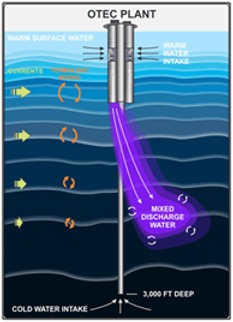
An OTEC plant produces energy thanks to a working fluid (water, ammonia, or other fluids) that goes through a turbine to generate electricity. To create a vapor with a pressure force that leads the fluid through the turbine, a vaporizer working with the elevated temperature of the hot sea water at the surface changes the working fluid from liquid to vapor. After, going through the turbine, the fluid is returned to liquid state using a condenser functioning with cold water taken deep sea. This cycle is repeated for a continuous electricity production. Hereunder, the figure displays the installation and basic characteristics of the Hawaiian OTEC plant which possesses an installed capacity of 100 kW.
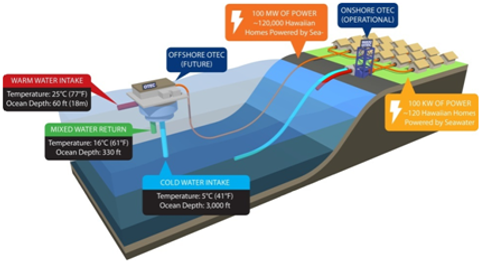
Figure 1: Hawaiian 100 KW OTEC plant
Three functioning cycles, that is to say 3 ways to circulate the working fluid, are known in the OTEC installations: the open cycle, the close cycle and the hybrid cycle. The three of them are hereafter presented.
Open cycle:

Figure 2: Open cycle
Figure 2 presents the basic principle of an open cycle. Hot water is pumped into a vacuum chamber (2). The low pressure permits the water to evaporate more easily and this vapor goes through a turbine which generates electricity. In this process, only 0.5% of the pumped water is turned into vapor. The condensed water is desalinated and constitutes an interesting by-product.
The close cycle:
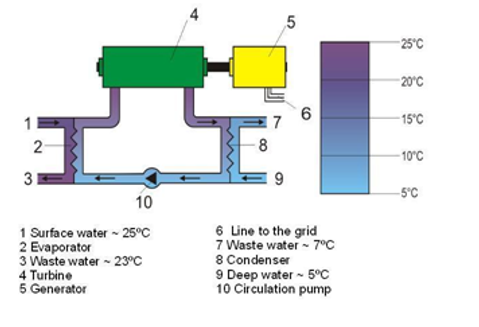
Figure 3: close cycle
Figure 3 displays the scheme of a close cycle system. This cycle is used in the Hainan OTEC plant. Unlike an open cycle, a close cycle does not necessitate a vacuum chamber. Indeed, ammonia is used as a working fluid which evaporates in normal pressure conditions at a much lower temperature than water.
The first step is to evaporate ammonia using the hot water in the evaporator (2). Then, the vapor generated goes through the turbine to generate electricity. The ammonia vapor is afterwards condensed thanks to the cold water in the condenser (8). The ammonia is trapped in a close cycle. The liquid ammonia is recirculated using circulating pumps (10) to be used again for other cycles.
The hybrid cycle
The hybrid cycle is a combination of both cycles. In this kind of cycle, the close cycle is used for electricity generation and the open cycle for desalinated water generation. As represented in Figure 4, the open cycle uses the cold ammonia out of the condenser of the close cycle to condense the water vapor produced in the vacuum chamber of the open cycle which at the same time heats and vaporizes the ammonia.

Figure 4: hybrid cycle
These three cycles can be used to produce electricity. The table below displays the pros and cons of each of them.
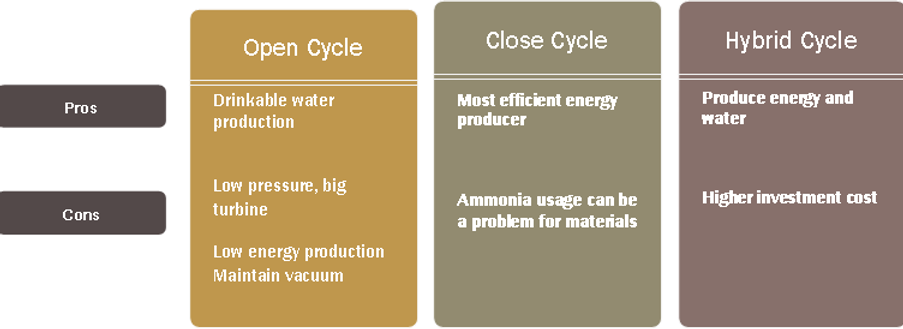
Table above sums up the pro and cons of all the cycle described previously.
Resources and installed capacity worldwide
An OTEC plant exploits the difference of temperature between two sources. In fact, in the ocean, it is common to find locations with different temperatures between surface water and deep sea water. For instance in Hawaii surface water is in average 26°C while deep sea water is around 3 to 4°C. The higher the temperature difference the better the efficiency of the OTEC plant is. However, oceans with highest temperature differences are not equally distributed over the world and are mostly found in tropical regions.
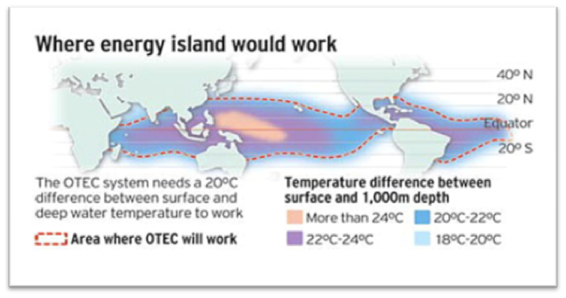
Figure 5 OTEC resources in the world
Deep sea water stays, wherever the location, at a temperature of 3-4°C contrary to surface water whose temperature depends on the geographic situation. As displayed in Figure 5, OTEC resources are predominant in tropical waters. This is due to the fact that the sunrays have the strongest warming power there, which leads to a higher temperature difference between surface and deep water. Hence, this is where a temperature difference between deep sea and surface water above 20°C can be found which is necessary for an OTEC plant to operate.
It has been estimated (Extractable-Ocean-Thermal-Resources-2005) that the resources extractable in the world represent in total 3 TW installed capacity. As a matter of comparison, China’s electricity production relies on approximately 1 TW of installed power. Therefore representing a considerable amount of available energy, OTEC plants have developed throughout the 20th century during which pilot plants were installed. Japan and Hawaii were and still are the most welcoming places for OTEC development.
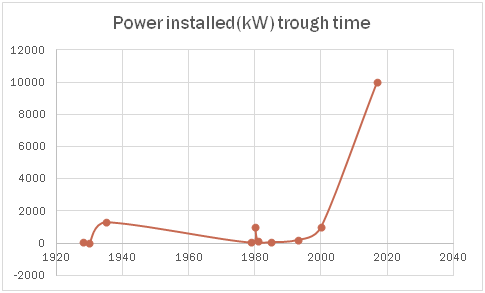
Figure 6 Power installed trough time
In Figure 6, the development world-wide of installed power plants capacities through time is displayed. From several kilowatts, OTEC is now aiming at 10MW facilities development by 2020. A particular effort in developing new energy sources as OTEC related to the petroleum crisis in the 80s is also notable.
Today, the most promising plant project is to be developed in Hainan. It should be achieved in 2017 under the joint effort of Lockeed Martin and Reignwood (US-CN partnership). The 10 MW prototype plant is expected to generate electricity for a whole resort located on the Hainan shore that will be marketed as a low-carbon real estate development. However, the construction works have not begun yet.
Limits and perspectives
The main limit to the development of OTEC is the high initial capital expenditure. As shown in Figure 7, the higher the capacity installed, the lower the final cost of energy production. This figure highlights the importance of designing high capacity plants.
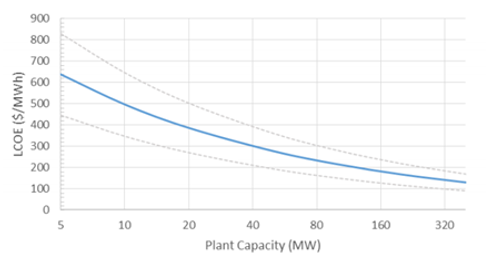
Figure 7: Levelized cost of electricity in function of plant capacity
An acceptable electricity price of approximately 100$/MWh could therefore be expected with a plant of 100MW.
OTEC plants could deliver secondary products as desalinized water, cold water and nutrient-rich water. Hence, regions with a chronical scarcity of water could widely benefit from an open cycle OTEC plant. Buildings could also be cooled down by this cold water. Also, the nutritive characteristic of water could be used to start aquaculture of cold water species like salmon, lobster, etc… Once sold, these secondary products could as well be included in the electricity price and make it decrease.
Conclusion
OTEC is a technology that could supply electricity, fresh water, and nutrient rich water. In the right temperature conditions, and adequate local electricity price, OTEC can now be developed. The first OTEC plant in Hainan, China, of 10 MW will serve as a kickoff event for this technology. With a capacity factor of 92%, OTEC could advantageously be offered to islands seeking for a permanent source of energy.
Moreover, greenhouse gases emission reduction targets and struggle against climate change could push political actors to support this emerging technology with subsidies, as it is already done for other renewable energies in numerous countries.
1.4. How green are blue technologies projects?
Impacts of Marine Renewable Energy on Biodiversity
Although Marine Renewable Energies (MREs) appear as a good alternative to limit the use of fossil fuels - mainly coal in China- for electricity production, they can have a strong impact on marine life. As MREs are recent technologies, very little information is available to evaluate their impact. MRE devices’ lifetime is split into 3 stages: construction, operation and dismantling. Studies show that the construction phase is the most impacting because of its very high noise level and destruction of the seabed. Erosion, impacts on the shore and collision risks make the operation stage the second most impacting.
Noise nuisance
In the sea, marine animals use ultrasound as navigational system (bio sonar) to orient themselves, communicate and capture preys. During the construction stage, big vessels’ traffic emits important noises. Also, most of the MREs are attached on the seabed and pile driving is used to provide foundation support for the devices. The use of pile driving creates high, dangerous noises for marine animals.
Indeed, high noise levels interfere with prey location, modify behaviors and movement patterns, mask important biological sound, limit communication and echolocation, and reduce resistance to disease. It also increases vulnerability and predation, creates stress, hypertension and hormonal imbalance, and leads to hearing loss and habitat loss. In some cases prospection by seismic measurements (similar to those used for oil prospection) are needed to choose suitable areas for MRE, impacting marine life through intense sound levels too.
In order to reduce sound emissions level, floating devices should be fostered as they do not necessitate the use of pile driving. If the attachment to the sea bed is necessary, a steel bucket can be used instead of pile driving to limit noises.
What is a steel bucket? http://www.theguardian.com/environment/2013/jan/22/suction-bucket-offshore-wind
Also, an air bubble curtain can be created around construction devices to avoid sound propagation into the sea.
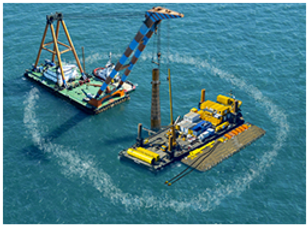
Image source: HYDROTECHNIK LÜBECK
Another solution is the “pinger method”. The latter emits animal-repelling sounds able to keep them away of construction sites. The soft-start mechanism can also be used to scare animals before the noise becomes dangerous by increasing gradually the energy of pile driving. However the risk for animals to get used to this sound and later not avoid the area is existent.
Furthermore, the management of construction steps (phasing) according to breeding seasons and migratory periods is required to limit impacts on marine animals.
Seabed destruction

Benthic habitat
https://commons.wikimedia.org/wiki/File:Benthic_GLERL_1.jpg
Little animals, such as amphipods, polychaete worms, snails, or chironomous midge larvas, live into the seabed and are called benthic animals. They are small but constitute essential elements of marine biodiversity. However, the foundation construction of MRE devices into the seabed put these species at risk. Avoiding sea-bed-fixed devices by using floating devices is the only solution to avoid this impact.
Otherwise, compensatory measures can be implemented by creating new suitable areas to attract key species before they get destroyed by the installation of the device. However, it is important to keep in mind that the destruction of a habitat cannot be completely offset by the creation of another.
Collision and displacement

http://nnmrec.oregonstate.edu/education/effects-environment
Other impacts are related to the operation of MRE facilities. The most obvious impact is the risk of collision with the installation, but also with its cables, power lines or free moving components. The animals risk to be injured or even to die. In order to limit this impact, devices can be designed to alert animals of the danger. Notably, sonars can be installed on the MRE devices to scare animals. In the case of MRE farms, a disposition in array of the devices can increase visibility for the animals and help them to avoid the zone.
Devices might also modify animals’ migratory routes. These new routes can be less suitable and threaten the animals’ well-being.
Overall, to limit the impacts, migratory routes and high biodiversity areas would better be avoided for MREs implementations.
Electromagnetic field (EMF)-related issues
Power cables transmitting power from the devices to the shore emit Electro Magnetic Fields (EMF). Some marine animals, such as bony fishes (eels and salmonids) and elasmobranches (sharks and rays), use electromagnetic fields for prey location, communication, vision and olfaction. The emission of EMFs can confuse animals by changing their behaviors, for instance their swimming direction, and disrupt their feeding practices. Furthermore, power cables produce thermal radiations that can affect microbial activity and threaten animals’ health.
In order to limit EMF emissions, cables should be buried. Nevertheless, before burial, the geological structure of the seabed needs to be taken into account. Indeed, some places are inadequate for such a practice. For instance, rocky sea beds do not allow cables burial and high biodiversity areas should be avoided. Shielding materials can also be used to reduce emitted magnetic flux.
To finish with, the best practice is still to carry out the routing with attention and avoid biologically diverse and rich areas.
Chemical pollution
Chemical pollution due to the use of antifouling paint and coatings against corrosion is not negligible. Also, working fluid leakage, as ammonia in the case of Ocean thermal energy conversion OTEC, can occur and be very harmful for marine life. In order to avoid that risk, the use of non-toxic products should be fostered. The use of cathodic protection limits the corrosion and thus avoids the need for coatings. Obviously, it is necessary to ensure the correct sealing of hydraulic fluids within the machines.
Conclusion
To conclude on the aforementioned environmental impacts, floating devices are far less impacting for marine biodiversity -less noise, no destruction of the seabed- and should be fostered. In order to limit such impacts, the device location should be wisely chosen considering the area’s biomass and migratory routes. Finally, more studies are needed in order to gain knowledge about MREs’ impacts.
Discharged water: focus on one major environmental drawback of OTEC technology
A serious concern arises with the huge water flows some technologies use and discharge in the ocean to produce electricity. Ocean Thermal Energy Conversion (OTEC) is one of them.
The most serious apparent impact of OTEC is known as the plume impact. In hydrological terms, a plume is a flow of fluid through another fluid. The OTEC power plant currently being designed in Hawaii illustrates how large this impact could be. This 100 MW plant would discharge flows reaching 800 m3 per s. Such a flow would be big enough to fill up an Olympic swimming pool in less than 4 s. Beyond mere considerations of flows, OTEC plants’ discharged water does not have the same properties as the surrounding ocean water. The discharged water is colder, has a higher nutrient concentration and can have a different pH and a different salinity. These properties arise from the plume, being a mix of the cold 1000-meter-deep water intake and the warmer surface water intake. The mix’s properties are very different from the surrounding water properties as the discharge would be located between 70 and 100 meters deep.

Hawaii’s OTEC plant and its discharged water. Plume, photic zone and water mixing are represented.
Source Plume illustration: http://www.makai.com/ocean-thermal-energy-conversion/
MAKAI, an environmental engineering company based in Hawaii, has been in charge of studying the possible environmental impacts on currents, water temperature, nutrient concentration and marine wildlife of discharging large amounts of water.
Before going any further, here are some key-words useful to understand the results of MAKAI’s team:
-
Primary production is the synthesis of organic compounds in the atmosphere or in the ocean by organisms at the bottom of the trophic chain (phytoplanktons)
-
Photic zone is the slice of ocean (depth-wise) which receives enough sunlight to enable photosynthesis
-
Mixed layer is the slice of ocean which is significantly mixed by surface winds
MAKAI’s team designed a complex model, based on several years of monitored data, of Hawaii’s marine environment (natural currents, winds, climate, nutrient concentration, temperature). The effect of discharging water in this natural marine environment as an OTEC plant would was then studied.
First, the hydro-dynamics of the plume and its impacts on water temperature and nutrient concentration were observed. A significant increase in nutrient concentration at the depth of discharge, located within the photic zone, was observed. This phenomenon results in a risk of an increase in primary production as an interaction between higher nutrient concentration and sunlight.
Then the impact analysis was pushed further in order to assess more precisely this risk. In this purpose, the model was improved by adding a primary production module.
The improved model was run and the following findings made:
-
If water is discharged deeper than both the photic zone and the mixed layer, life development is not altered. Indeed, in this case discharged water does not interact with phytoplankton and neither is it mixed with the above water.
-
However, the studied plant would have some complex effects on life development as discharge is not so deep. These effects appear several kilometers away from the plant, and might disrupt the local biodiversity. They arise from interactions of currents, winds and weather only at some times of the year.
A last model was run featuring three OTEC plants discharging water in a limited area. The observed effects were equivalent but multiplied.
Such models can help choosing locations to implement new OTEC plants. It can also help designing OTEC plants (discharged flows, depth of discharge…). In a word, it is a powerful tool to assess plume impacts on marine life and to help designing OTEC plants. However, these models require big amounts of data about local currents, climate and water quality. Gathering several years of precise, local data before designing the plant is therefore a necessity. These kind of pre-design impact analyses are already performed in the field of large dams in order to take into account exceptional weather events in the designs. This could be generalized to OTEC power plants, should this technology spread at a larger scale.
Sources
-
U.S. Department of Energy, 2012, Modeling the Physical and Biochemical Influence of Ocean Thermal Energy Conversion Plant Discharges into their Adjacent Waters
-
Christina M. Comfort and Luis Vega, 2011, Environmental Assessment of Ocean Thermal Energy Conversion in Hawaii
-
Greg J. Rocheleau and Patrick Grandelli, 2011, Physical and Biological Modeling of a 100 Megawatt Ocean Thermal Energy Conversion Discharge Plume
1.5. Marine Renewable Energies in China: How Promising are they to Tackle Climate Change?
The operation and possible impacts on biodiversity of MREs under development in China have previously been described. This section aims at studying their impacts in terms of climate change and particularly their potential for greenhouse gases emissions savings.
A model needs to be built and several important assumptions, presented hereafter, made in order to calculate the carbon savings enabled by MREs.
China mainly produces electricity from coal and some from hydropower (see China electric mix hereunder).

Coal power plant in Inner Mongolia, China
Innovative and carbon free technologies are being developed in China. They will presumably replace coal-based electricity production means. Hence, a first assumption is to consider every kWh of electricity produced from marine energy to replace a kWh of electricity produced from coal. This first assumption is strong. Indeed, China is currently adding new coal-based production sources as opposed to replacing coal-based power plants.
Also, the presented innovative technologies are considered carbon free. Equivalently, the emissions allowed to the construction of these technologies and to their maintenance are neglected, with regard to the number of kWh they would produce within their lifetimes.
Under these assumptions, the amount of avoided CO2 by producing 1 kWh of electricity from marine technologies can be considered equal to the amount of CO2 emitted when producing a kWh of electricity from coal. This quantity can be estimated knowing coal quality and power plant efficiency.
The type of coal used in the People’s Republic of China and the amount of CO2 its combustion releases are represented in the following figure:
China's electrix mix
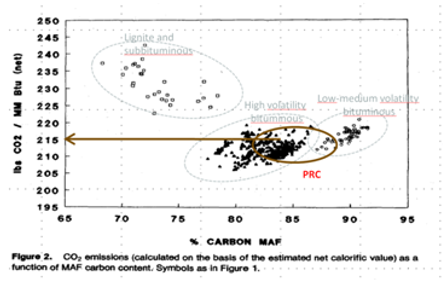
Hence, for each kWh of electricity from coal produced in China, about 1 kg of CO2 is emitted (assuming here a 34% efficiency of coal power plants in China, which is actually the usual figure for U.S. coal power plants).
Total savings from the presented marine technologies have then been computed. For each technology, load factors have been assessed through literature review of existing projects or roughly estimated when no data was found. For instance, load factors currently involved in wave energy are less than 20%, but with improvements they could reach 20%. The 100 kW Eco-wave project was allowed a 20% load factor.
Under these assumptions, Eco-wave would save 170 tCO2/yr. The 300 kW Guishan Channel project (tidal energy) would save 520 tCO2/yr. The 10MW OTEC plant project in Hainan would save 77 ktCO2/yr. As a comparison reference, a round trip Paris-Beijing emits 250 tCO2/yr. CO2 savings from marine renewable energy production might seem low but technologies are still under study and are still being developed at very low scales.
Marine renewable energies have a very limited capacity to replace coal in the Chinese electricity production nowadays, because installed capacities are extremely low. These technologies are under development and are called to grow. For tidal and wave energies, load factors are bound to remain low, around 20%. On the contrary, OTEC technology can reach load factors close to 100%. As a result, OTEC is more likely to play a role in replacing significant shares of coal in China than tidal and wave energy. Tidal and wave energies could find their most useful place by remote islands where the use of fossil fuels coming from mainland is constraining and costly.
Sources :
-
DGAC website, 2015, http://eco-calculateur.aviation-civile.gouv.fr/
-
Richard A. Winschel, 1990, The Relationship of Carbon Dioxide Emissions with Coal Rank and Sulfur Content, Journal of the Air & Waste Management Association, 40:6, 861-865
-
Coal Geology, Par Larry Thomas, ISBN: 978-1-119-99044-4
-
OCEAN POWER DELIVERY LTD, 2015, presentation on the web: The Pelamis Wave Energy Converter
-
Silvia Bozzia, Renata Archettib, Giuseppe Passoni, 2014, Wave electricity production in Italian offshore: A preliminary investigation, Renewable Energy (Impact Factor: 3.48). 02/2014; 62:407-416
-
EIA, 2015, http://www.eia.gov/electricity/annual/html/epa_08_01.html

2. Overview on Chinese mariculture
2.1. Chinese mariculture's presentation
Feeding citizens is one of the top priorities of governments and the ocean is a precious resource for food. Combined with demographic growth, it explains why seafood consumption worldwide has doubled in the last 30 years (FAO, 2000). In the meantime, available stocks of fish in oceans have sharply decreased and aquaculture methods have been increasingly questioned. Indeed this sector grew at rate of 8.3% per year since 1970, three times higher than the agricultural growth rate(Diana, 2009). There are 3 main types of aquaculture: fed aquaculture (like for fin fishes), inorganic extractive aquaculture (for all algae) and organic extractive aquaculture. Freshwater used for inland aquaculture is very limited and precious with an ever increasing demand, highlighting the importance of mariculture . As a consequence, the volume of mariculture doubles each decade (FAO, 2008).
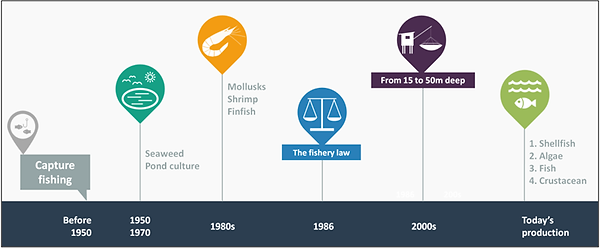
History of Chinese aquaculture
According to S. Y. Lin, an acknowledged Chinese aquaculture specialist, the earliest beginnings of aquaculture occurred within the period 2000–1000 B.C. China was a precursor mostly through the culture of the common carps (Cyprinuscarpio). The following figure shows some milestones of Chinese mariculture history. The government started to regulate this sector in the 1980s to ensure the durability of the system through the creation of the Bureau of fishery (linked with the Ministry of Agriculture). Today, the sector is managed according to the 12thFive-year “Plan for fisheries development”(2011–2015). Thanks to these measures and to technologies allowing the intensification of the production, China’s output from aquaculture is currently the largest in the world and accounts for about 67% of the world’s total production.
Chinese coastal geography
China has a favorable geography for mariculture thanks to over 18000km of coastline and a diversity of climates from temperate to tropical zones. This allows China to raise a wide range of species: 1700 marine fishes and thousands of aquatic plants and animals (such as crustaceans, mollusks and cephalopods) with good economic value. To do so, the country relies on the access to 4 major seas. The Bohai and the Yellow Seas are semi-close in temperate zone and have shallow waters and flat bottoms which mean great swamping and nursery grounds. The East China Sea has rich nutrient runoff from large rivers, making it a favorable place for high productivity activities and there are currently more than 40 different species produced in those waters. Last but not least, the South China Sea has a deep and closed basin with a complex terrain, making it a good resource as well. (FAO, 2008).
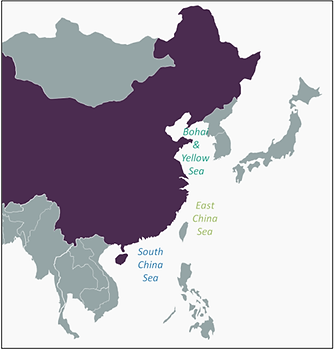
Map of Chinese seas
Chinese mariculture techniques
Several mariculture techniques are applied in China. Land-based aquaculture is used in ponds, mostly to produce shrimps and some marine crabs like swimming crabs and Samoan crabs. On the other hand, offshore mariculture resorts to three main techniques. The floating raft culture is used to raise shellfishes like scallops, oysters, etc. Cage culture is relatively new in China and is used to culture some high value fishes like sea breams, sea basses and big yellow croakers.
Chineses mariculture history
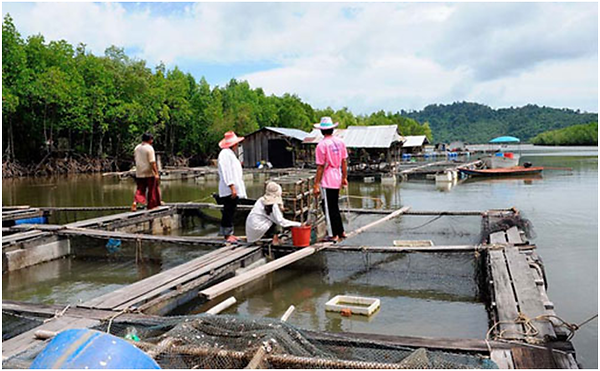
Marine finfish cage culture in China, source: http://www.thefishsite.com/
Last but not least, tidal flat culture plays an important role in China.. In China, this kind of culture is used for animals with weak moving abilities like scallops, mussels, abalones, sea cucumbers and clams. All these species can be raised in automatedindustrialized cultures producing all year long. Cages are at a depth of 15 to 50 meters.
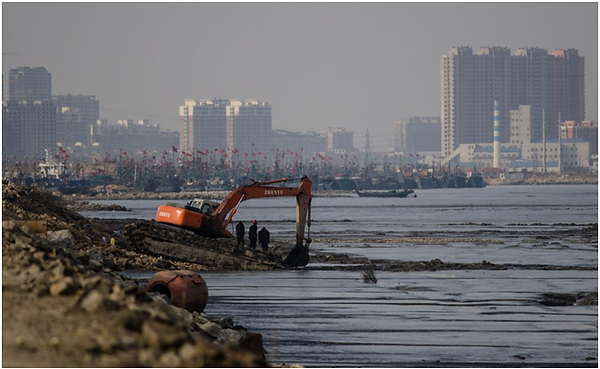
In China alone more than 1.2 million hectares of wetland reclamation has taken place in the last 50 years, perhaps accounting for more than 5 per cent of the worlds’ tidal wetlands. Image and legend: Nick Murray
Marine species produced in China
In the 1950s, pond culture was the prevailing form of aquaculture in China. Kelps, lavers (Porphyras) and mussels accounted for 98%in volume of total marine culture output (Bureau of Fishery, 2005). In the 1980s the production of mollusks, shrimps and finfishes started. Today, China cultivates more than 30 species. Shellfishes represent the major part of the production(abalones, scallops and mussels), followed by algae, fishes and crustaceans (such as shrimps and crabs). Regarding fish production, 10species represent 60.3% of the total mariculture fish production: sea basses, left-eyed flounders, large yellow croakers, red drums, sea bream, groupers, cobias, puffer fishes, amberjacks and right-eyed flounders. On the other hand, mollusks are the major marine species group farmed accounting for approximately 33.20%of the Chinese aquaculture output. In 2002, according to the Chinese Bureau of Fishery, the production included oysters (3.63 million tons), clams (2.30 million tons), scallops (935 585 tons), mussels (663 866 tons), and razor clams (635 486 tons).
Chinese mariculture in a few figures
Chinese aquaculture represents 52.4% of the national marine fishery, making it the first country in the world where aquaculture is more important than capture (Bureau of Fishery, 2010). Furthermore, thanks to a good geography, improved technical skills and favorable laws, Chinese mariculture grew at an exponential rate since the 1990s as showed on the following figure. China has also been the largest global mariculture producer for more than two decades and the world's leading exporter of seafood and fishery products since 2002 (Pan, 2005). But such an important expansion comes along with challenges.
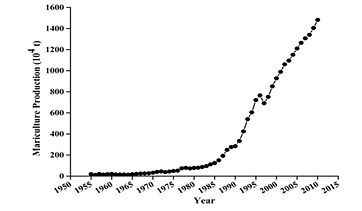
Temporal variation in mariculture production since 1954 in Chinese coastal waters (Yang et al., 2015)
Sources
-
FAO, 2000, Food and Agriculture Organization of the United Nations The state of world fisheries and aquaculture 2000.Electronic edition. http://www.fao.org/docrep/003/x8002e/x8002e00.htm
-
Diana, 2009.Aquaculture production and biodiversity conservation. BioScience. 59: 27-38.
-
FAO, 2008. FAO Fisheries Circular No. 1029.Electronic edition. http://www.fao.org/docrep/014/i0111e/i0111e00.htm
-
Bureau of Fisheries, Ministry of Agriculture, People's Republic of China, 2005. China Fisheries Statistic Yearbooks, 1979-2004.
-
Bureau of Fisheries, Ministry of Agriculture, People's Republic of China, 2010.China Fishery Statistical Yearbook. China Agriculture Press, Beijing.
-
Pan, China's aquaculture industry: developments and challenges, Rabobank Int (2005), p. 20
-
Yang, Chai, Wang, Chen, He, Jiang, 2015.Cultivation of seaweed Gracilaria in Chinese coastal waters and its contribution to environmental improvements.Algal Research.9 : 236-244.
2.2. The issues related to Chinese mariculture
The three main consequences of intensive mariculture are: eutrophication coming along with its generated impacts, loss of biodiversity due to ecosystem destruction and the risk of impacts on human health through fish diseases and the excess use of antibiotics.
Eutrophication and algal blooms
The eutrophication of an area is link to the nitrification process. Ammonia, hydrogen, sulphide and methane will react together and produce nitrate. Algae will use the nitrate as fertilizer and multiply until depraving water from oxygen. During the intensive culture of marine species, a large amount of nutrients is directly discharged into coastal waters from open-water systems (Chopin et al., 2001). Those nutrients are linked to fish feces as well as fish food waste. The most impacting mariculture technology regarding this issue is the net-pen system (the most developed one in China). In this situation, water is transported through the cages by currents, resulting in an incomplete utilization of feed resources, which will then sediment and contribute to the degradation of the water quality.
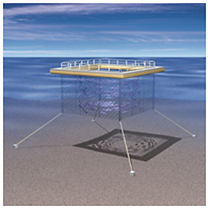
Figure : Net pen system, image source : http://www.seachoice.org
One of the most noticeable impacts of eutrophication is algae bloom (or the red tide linked to minute planktonic organisms). The most impressive example of algae bloom is described in the following figure. The negative reaction does not stop with algae invasions as the blooms and their decomposition can also deplete oxygen in the water, causing animal’s death (Qian et al., 2001). Those issues might have a long term impact if not tackled fast. For example, the increasing frequency of red tides, which devastated shrimp farms in the north Chinese coastal waters, poses a serious threat to future development (Liu and Liu, 2001).
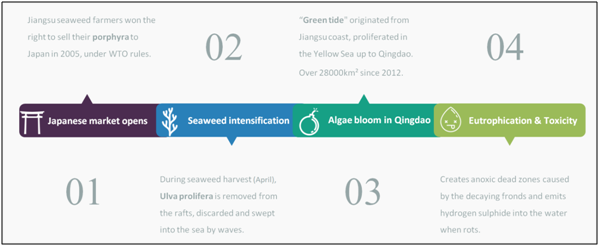
Consequences of intensive seaweed culture in Qingdao
Ecosystems and biodiversity loss
The ecosystem destruction is mainly due to sea water pollution as it modifies the ecosystem when it does not destroy it. An example of such destruction can be found in the Guangxi Province where the area occupied by the mangrove decreased by 20 to35% from 1980 to 2000 (Valiela, 2001). Another human impact is the modification of the hydrologic regime of some areas. In several cultures the enclosure influences the living condition of fish by modifying the currents and the available space. The intensive cultivation of very specific species limits the number of parental organisms and creates a loss of genetic diversity.
Sources
-
Valiela, Bowen, York, 2001. Mangrove forests: one of the world’s threatened major tropical environments. BioScience 51, 807-815.
-
Chopin, T., Buschmann, A.H., Halling, C., Troell, M., Kautsky, N., Neori, A., Kraemer, G., Zertuche-Gonzalez, J., Yarish, C., Nee- fus, C., 2001.Integrating seaweeds into aquaculture systems: a key towards sustainability. J. Phycol. 37, 975–986
-
Qian, P.Y., Wu, M.C.S. and Ni, I.H. (2001) Comparison of nutrients release among some maricultured animals. Aqua- culture 200, 305–316
-
Liu, C.L. and Liu, S.L. (2001) Mariculture development situations and sustainable development problems in China. J. Oceanogr. HuanghaiBohai Seas. 19, 100–105 (in Chinese with English abstract)
2.3. Integrated Multi Trophic Aquaculture: a sustainable solution for industrialized mariculture
In order to tackle some of the issues raised by the sharp increase of fish production in China, some innovations in the aquaculture sector have been developed in the recent years.
Definition and benefits of Integrated Multi Trophic Aquaculture (IMTA)
The concept of Integrated Multi Trophic Acquaculture(IMTA)is based on the culture, in a same area, of species with complementary trophic levels. The by-products (wastes) from one species are recycled and turned into inputs (fertilizers, food and energy) for another species(Chopin, 2013).
Farmers can combine the cultivation of “fed species” such as finfishes or shrimps with “extractive species” such as seaweeds and aquatic plants that recapture inorganic dissolved nutrients, and shellfishes or other invertebrates that recapture organic particulate nutrients for their growth(Barrington, Chopin, & Robinson, 2009).
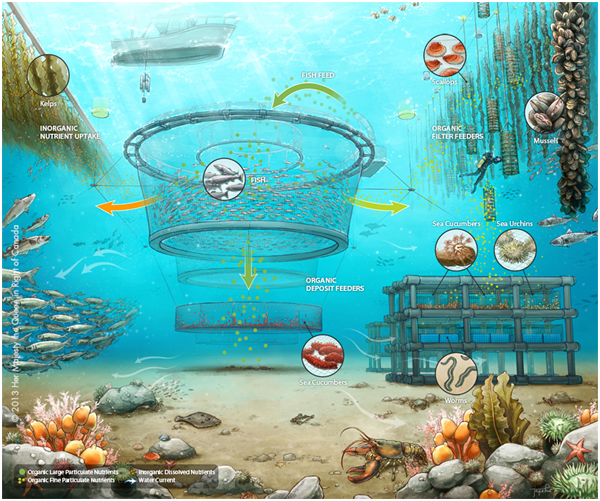
Figure : IMTA technique
IMTA promotes economic and environmental sustainability by converting byproducts and uneaten feed from fed organisms into harvestable crops, thereby reducing eutrophication, and increasing economic diversification (Troell et al., 2009).
IMTA application in China
In China, two main techniques of IMTA are applied:
- Suspended multi-species aquaculture, generally in shallow near-shore waters
- Multi-species large scale sea ranching in deeper and more offshore waters (Barrington et al., 2009)
Some large scale IMTA projects have been carried out in China. For instance, near Zhangzidao Island, 40 miles offshore in the northern yellow sea, 40 000 ha are cultivated following the IMTA technique: 26 500 ha of scallops, 10 000 ha of arkshells, 660 ha of sea cucumbers, and 100 ha of abalones, with a total harvest of 28 000 tonnes in 2005.
Studies on IMTA have highlighted the great environmental benefits of this technique. In the coastal waters of Xiangshan harbor in the East China Sea, the amount of phosphates, nitrites, ammonium and nitrates has been reduced by 58%, 48%, 61% and 47%, after the implementation of the IMTA technique (Huo et al., 2012).
An ecological and economical assessment of monoculture and integrated multi-trophic aquaculture has been completed in Sanggou Bay, China. The results of the study are displayed in the following Figure
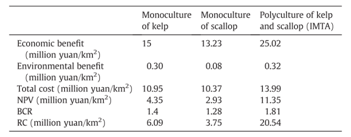
Figure : Benefit cost analysis of the different culture models
IMTA appears to bring higher financial returns, to increase the net present value of the project and to improve the environmental conditions of the culture (Shi, Zheng, Zhang, Zhu, & Ding, 2013).
In April 2015, Zoneco's fishery (Zhangzidao Island) has officially become the first fishery in China to gain the Marine Stewardship Council (MSC) certification thanks to the use of an IMTA system.
Limits of IMTA
It is important to note that even if IMTA seems to be a great improvement compared to traditional aquaculture, it does not solve all mariculture-related issues. Diseases and escapes of farmed fish into the wild are not tackled. Besides, if the ratio between fed and extractive species is not properly calculated and implemented, the system can cause great damage to the environment (Jiang, Fang, Mao, & Wang, 2010). As a matter of fact, the massive scale of some of the systems can create an accumulative effect and thwart the environmental benefit of IMTA.
Sources
-
Barrington, K., Chopin, T., & Robinson, S. (2009). Integrated multi-trophic aquaculture (IMTA) in marine temperate waters. Integrated Mariculture - A Global Review - FAO Fisheries and Aquaculture Technical Paper N0. 529, (July 2015), 7–46. doi:10.1016/S0044-8486(03)00469-1
-
Chopin, T. (2013). Integrated Multi-Trophic Aquaculture, (November).
-
Huo, Y., Wu, H., Chai, Z., Xu, S., Han, F., Dong, L., & He, P. (2012). Bioremediation efficiency of Gracilaria verrucosa for an integrated multi-trophic aquaculture system with Pseudosciaena crocea in Xiangshan harbor, China. Aquaculture, 326-329, 99–105. doi:10.1016/j.aquaculture.2011.11.002
-
Jiang, Z. J., Fang, J. G., Mao, Y. Z., & Wang, W. (2010). Eutrophication assessment and bioremediation strategy in a marine fish cage culture area in Nansha Bay, China. Journal of Applied Phycology, 22, 421–426. doi:10.1007/s10811-009-9474-1
-
Shi, H., Zheng, W., Zhang, X., Zhu, M., & Ding, D. (2013). Ecological-economic assessment of monoculture and integrated multi-trophic aquaculture in Sanggou Bay of China. Aquaculture, 410-411, 172–178. doi:10.1016/j.aquaculture.2013.06.033
-
Troell, M., Joyce, A., Chopin, T., Neori, A., Buschmann, A. H., & Fang, J.-G. (2009). Ecological engineering in aquaculture — Potential for integrated multi-trophic aquaculture (IMTA) in marine offshore systems. Aquaculture, 297(1-4), 1–9. doi:10.1016/j.aquaculture.2009.09.010
Another lead: Mangrove eco-farming
Mangroves refer to various large and extensive types of trees that grow in intertidal zones, mainly in the tropics and subtropics. Mangroves can be of help to protect coastlines and provide a suitable nursery for microorganisms [1].

The issues regarding mangrove
However, due to anthropogenic conversion and seawater pollution, the amount of mangroves in China has drastically decreased. The total area of mangrove in the country has shrunk from 50 000 ha in the 1950s[2]to around 22 000 ha in 2001. Thus, eco-farming systems paying attention to trees and mangroves conservation are required in order to solve the conflict between mariculture and ecosystem conservation.
A solution
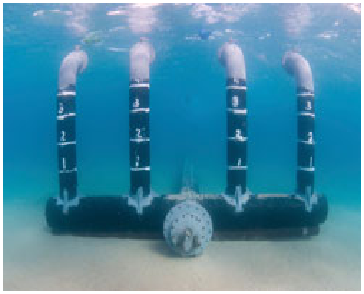
An advanced system called “Underground tube mangrove in situ eco-farming system” has been operated in Guangxi Province since 2009.
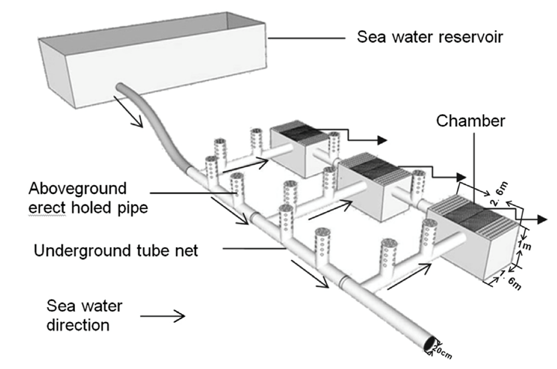
Figure : Mangrove eco-farming system
As shown in figure 3, the eco-farming system consists of the installation of chambers, adequate for fishes production, linked together by a system of pipes to permit exchanges of water between the chambers.. Its underlying principle is to provide a closed and immerged area suitable for mariculture while minimizing disturbance to the mangrove system. The reservoir can be used as a shrimp pond, which stores and oxygenates seawater during high tide. During the low tide it will allow water to flow towards the other parts of the system. The erect pipes increase the level of dissolved oxygen during high tides and allow tiny organisms to enter the chambers and be used as fish food.
This underground tube mangrove in situ eco-farming system efficiently combines mangrove conservation and development of mariculture simultaneously.
Limits
However, this technique still has room for improvement. First of all, more trials are needed to generalize this system to other intertidal zones. Secondly, the impacts of mariculture on mangrove wetland systems should be monitored and evaluated. Disease control methods need to be explored further to ensure healthy products. Finally, international standards for eco-farming and mangrove protection should be established.
Sources
-
Thatoi H, Behera B C, Mishra R R, et al. Biodiversity and biotechnological potential of microorganisms from mangrove ecosystems: a review[J]. Annals of Microbiology, 2013, 63(1): 1-19.
-
Li M S, Lee S Y. Mangroves of China: a brief review[J]. Forest Ecology and Management, 1997, 96(3): 241-259.
-
Fan H, He B, Pernetta J C. Mangrove ecofarming in Guangxi Province China: an innovative approach to sustainable mangrove use[J]. Ocean & coastal management, 2013, 85: 201-208.

3. Desalination: a sustainable solution to freshwater shortage ?
3.1. Desalination of Seawater in China: An Overview
The insufficiency of freshwater has become a growing concern all over the world. Presently, over one-third of the world’s population lives in water-stressed countries and by 2025, this figure is predicted to rise to nearly two thirds. Desalination has been considered as an essential way to solve the global water crisis. China suffers from severe water shortage: 66 percent of cities experience water shortages and nearly 54 billion cubic meters in average per year are missing.
China has a long coastline with many islands, nearly 40% of the total population lives in coastal area. Desalination projects could provide a solution to tackle an increasing demographic and therefore water shortage pressure.
Incentives for desalination in China
Researches on seawater desalination in China date back to 1958. One of the milestones of desalination development in China was implemented in the 7th Five-year Plan of China, when the Reverse Osmosis (RO) process for desalination was listed as one of the major research topics of the country. In 2005, China launched a national plan entitled Special plan for Seawater Utilization that marked a brand new period of seawater utilization in China. The year 2012 has experienced the launch of national documents including the Guidelines on Accelerating the Development of the Desalination Industry by the State Council, the 12th Five-year Plan on Seawater Desalination Industry and the 12th Five-year Special Plan for Seawater Desalination Technology, which give incentive for desalination related research.
Industry Scale and Space Distribution
China is undergoing a steady growth in desalination project capacity and scale. By the end of 2014, China has already built up 112 seawater desalination projects with a total capacity of 926,905 m3/d.
In terms of space distribution, by the end of 2014, seawater desalination plants have been introduced to 9 coastal provinces in China, coastal cities and islands short of water resources in particular. Most of the completed desalination plants were located in Liaoning, Shandong, Hebei, Tianjin, and Zhejiang.
Development of the Desalination Industry in China
China is undergoing a steady growth in desalination project capacity and scale. By the end of 2014, China has already built up 112 seawater desalination projects with a total capacity of 926,905 m3 per day.
In terms of space distribution, by the end of 2014, seawater desalination plants have been introduced to 9 coastal provinces in China, coastal cities and islands short of water resources in particular. Most of the completed desalination plants were located in Liaoning, Shandong, Hebei, Tianjin, and Zhejiang.
Technology and Application
Among all the technologies in commercial application, RO (Reverse Osmosis), LT-MED (Low Temperature Multi-Effect Distillation) and MSF (Multi-Stage Flash) technologies are the most commonly employed around the globe. In China, 64.69 % desalination plants, i.e. 99 plants, with a total capacity of 599,615 m3 per day, adopted the RO technology to desalinate seawater. LT-MED technology comes second. MSF and electro osmosis technologies are to be mentioned as well.
MSF and LT-MED technologies can be applied to seawater with high salt concentration but are energy-consuming. Compared to distillation, the membrane process is an energy-saving technology.
When it comes to the end user of the desalinated water in China, industrial water and civil water supply are two main categories. Fresh water from desalination can be used by high-water-consuming industries, such as electricity generation and steel, and these industries are mainly located in Tianjin, Hebei and Shandong. On the other hand, desalination projects for civil water supply are distributed in Southern China, namely, Zhejiang, Fujian and Hainan.

Map of China with all provinces, from www.sacu.org
Cost and Energy Consumption
The major cost for seawater desalination projects come from investment, operation. In fact, the cost for operation lies in maintenance, chemicals and membranes and energy consumption. The cost for desalinated water is normally 5 to 8 yuan per ton, which is quite close to the international level. Thanks to scaling factors, projects with a capacity above 10 thousand m3 per day have an average cost of 6.37 yuan per ton, compared to 8.44 yuan per ton for projects with a capacity of thousand m3 per day.
Prospects and Challenges
China now is one of the most promising markets for seawater desalination. However, there is still a gap between China and developed countries such as US, Japan, Singapore and some European countries. To begin with, the capacity of desalination in China still cannot fully parallel with the output of Chinese economy as well as the population. Secondly, with only 60% of the equipment and technology from China itself, China is still on its way to independence in terms of property rights. Also, China needs to perfect the market system as well as related regulations and industrial standards. Another challenge lies in the relatively higher cost of desalinated water compared to that of tap water, especially for desalination plants with a smaller capacity. With that being said, a more reasonable pricing and subsidy mechanism needs to be introduced. However, where there are challenges, there are developments. With the expanding demand of fresh water especially in coastal areas with rapid development along the retrospect and prospect of seawater desalination in China, there are good reasons to foresee a promising and bright future for desalination industry in this soundly developing country.

Solar still desalination equipment, from www.sswm.info
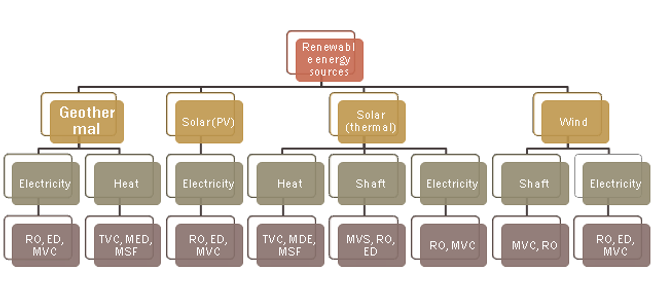
The following figure shows several ways to combine renewable energy with desalination process, and it can be used to guide the design of desalination plants.
3.2. Renewable energies and desalination
Why turning to renewable energy sources in the desalination sector?
Since seawater desalination processes are highly energy consuming, environmental impacts can be a real issue if fossil fuels are the only energy source. Fortunately, renewable energy resources are always abundant in coastal areas, so it can provide an alternative and environmental friendly solution.
Besides, there some other issues justify the use of renewable energy sources as a suitable substitution:
-
Both renewable energy systems and desalination refer to self-sufficiency and local support, in this way, the combination enforces sustainable socioeconomic development by using local resources.
-
Diversification of renewable energy sources can help to avoid extreme dependence on energy supply, which is suitable for the less developed countries with both water and energy shortage problems.
-
Tourism is often a major industry in coastal areas, so it increases the demand in fresh water. Furthermore, tourist frequentation usually goes along with high solar energy availability. Therefore, renewables are a reliable solution to parallel with the chronical freshwater season demand.
Practical insights on the combination of renewables with the desalination process
Renewable energy driven desalination falls into two categories. The first includes distillation processes driven by heat directly produced by renewable energies; the second includes membrane and distillation processes driven by electricity or mechanical energy indirectly produced by renewable energy sources. Renewable energies used in desalination include wind, solar thermal, photovoltaic and geothermal. The most common method is using sun rays with solar stills equipment. A number of desalination plants consisting of glass covered solar stills have been constructed in many parts of the country in the late 1960s.
Combinations of RES and desalination processes (photovoltaic, RO: reverse osmosis, ED: electrodialysis, MVC: mechanical vapor compression, MED: mutli-effect distillation, MSF: multi-stage flash distillation, TVC: thermal vapor compression)
Even though there are still many research focusing on the best combination of Renewable Energy Systems (RES) and desalination technologies, a broad range of installation of RES desalination facilities is already implemented. The distribution of renewable energy powered desalination technologies is presented in the following pie chart. The table below shows the relationship between various energy inputs and criteria for desalination technologies.
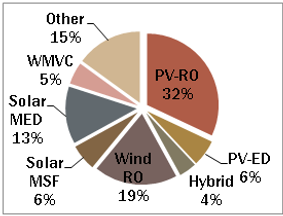
Figure 2 : Distribution of renewable energy powered desalination technologies
Table: Evaluation of renewable energy technologies
One of the pioneer desalination projects combining RES is Dafeng Wind Power Desalination Project in Jiangsu Province, with a total investment of 235 million yuan. The design capacity is 10,000 tons per day. The first part of the project, finished in 2014, has a capacity of 5,000 tons per day, consisting of grid wind power generation system, water supply and pre-treatment system as well as desalination system. The wind power used in the plant is not connected to the grid but is directly used for desalination process. In the absence of any electrical network, the plant is ran by one 2.5 MW permanent magnet direct driven by wind turbines, three groups of storage batteries and a diesel generator based in the micro-grid power supply system. All of those provide a reliable power supply for the desalination plant. This kind of non-grid-connected wind power helps to solve the problem of abandoned wind not able to connect to the grid, and to reduce the consumption of coal-fired electricity network.
Limits of the joint utilization of RES and desalination
In spite of the advantages of combining RES with desalination, the current installed systems of RES–desalination are scarce and limited to around 0.02% of the total desalination capacity. The reasons for the low penetration of RES-powered desalination installations are as follows.
-
Availability: geographical distribution of RES potential does not always comply with the water needs;
-
Costs. The initial instillation is expensive, which makes commercialization difficult;
-
Technologies. A real challenge for technologies which make the combination of energy conversion and the desalination systems would be the optimum technological design of combined plants that can both increase the efficiency as well as processed volume and decrease costs;
-
Sustainability. In most areas with severe water stress, infrastructures are not well-developed enough to match new technologies.
Besides, conversion of renewable energies including solar and wind requires high investment cost. Until now, the technology is not yet mature enough to be exploited with large-scale plants.
Conclusion and prospect
The use of renewable energies for desalination appears nowadays as a reasonable and technically mature option for the emerging energy and water problems. However, in spite of intensive research worldwide, the actual penetration of RES-powered desalination installations is still low for some reasons related to aspects such as availability of renewable energy source, cost, technologies and sustainability. Among different technologies of renewable energy application in desalination, the most mature ones are wind and PV-driven membrane processes and direct and indirect solar distillation, which can be considered for commercialization.
3.3. Environmental Impact of brine release
Coastal desalination plants have a major impact on water pollution. This section will explain the impact of brine release on the environment.
Brine characterization
Brine is the fluid waste from the desalination plant. As every wastewater, it is not pure and contains various chemicals, which can reach high levels. Rejected back into the sea, these chemicals will lead to environmental issues.
First of all, brine contains high percentage of salt. Brine has an extremely high alkalinity, due to calcium carbonate and calcium sulfate. In some plants, the alkalinity has been measured to 2.32 x10⁻³ mol.kg-1 (0.60-1.80 x10⁻³ mol.kg-1f or usual tap water). It is sometimes mentioned that salinity and alkalinity in the brine are at least multiplied by two compared to input sea water. Brine is also loaded with several chemicals additives. Most of them are coagulants, antiscalants, biocides, anti-foaming additives and detergents; the latters being added to prevent membrane fouling. Additionally, brine sometimes contains toxic metals (zinc, nickel, iron, chromium, nickel and molybdenum).
Brine release and related issues
There are several options for brine disposal, each one with its own advantage and inconvenient:
-
Discharge into evaporation ponds. It required large amount of space. Also, ponds will concentrate the pollution. Therefore they will have to be properly managed, at least monitored;
-
Discharge into saline rivers that will then flow into and estuary. This is a serious threat to ecosystems;
-
Injection into a confined underground aquifer. Uncertainties and hazards of geological activities also represent a threat. Additionally, technical challenges are consequent. Chemicals sent underground will have to be buried in waterproof geological layers in order to mitigate environmental hazards;
-
Most of the times, especially in the largest desalination plants, the brine is directly released into the sea. This option is the cheapest and the simplest.
The brine can either be released pure, or mixed with other effluents such as wastewater or cooling water. Following the discharge, the brine diffusion will have direct consequences on the environment. To this extent, several parameters influence the dilution: dispersion, mixing and turbulence of the local waterbody.
Additionally, the salinity also impacts the brine dispersion. Highly salted water is denser than sea water. Heavily salted brine will sink at the bottom of the waterbody it is released in. Since water currents are usually weaker in deep water, it results in a slower dilution[3]. Also, the dispersion effects create a gradient in concentration of all chemicals and temperature.
Impact of brine release on marine ecosystems
Brine release has several impacts on the marine environment, including the following: sea salinity, turbidity and temperature increase, water currents, anoxia and toxicity. As high as these effects might be, they still remained localized since the pollution source is localized. Those can be detailed:
-
Impact of salinity and alkalinity changes: it can significantly alter the growth, propagation and size of aquatic life. The number and diversity of species is impacted. However, high salinity can also benefit to shellfish and other similar species which use dissolved salts to build their shells. As for the specific impacts of alkalinity changes, there is a gap in scientific experiments which does not enable reliable conclusions. Further research in this field is required.
-
Impact of temperature changes: In Reverse Osmosis plants, brine temperature does not exceed seawater temperature by more than 1°C. The temperature issue arises when brine is mixed with other effluents, such as cooling water or wastewater. In this case, temperatures as high as 57°C could be reached. Then, natural balance and marine life distribution can directly be impacted by temperature alteration. Studies show that fauna and flora physiological parameters are directly correlated to water temperature. Mobile species, such as plankton and fishes, are the most impacted.
Coral reefs and seagrasses are also extremely sensitive to changes in the physicochemical parameters of their surrounding water. Therefore, they are significantly impacted by brine release[6]. Finally, it has been proven that chemicals and metals are toxic to marine organisms, even at low concentrations.
Brine discharge, from www.rsc.org
Suggested solutions for brine release impacts mitigation
Solutions exist in order to minimize the impacts of brine release. At the source, the amount of chemicals added to water can be reduced and replaced by micro and nano-filtration. At the discharge point, solutions are also implementable. To date, over 90% of large desalination plants dispose of brine through a specific pipe. Therefore, this pipe can be adapted in order to mitigate the discharge environmental impact. For example, dispersion can be enhanced by adding diffusers at the end of discharge pipes.
Another impact: sea water intake
Impacts due to water intake are also to be mentioned. The intake can be direct or indirect, the first case leading to high impingement on marine organisms due to the large volume of seawater needed (on average 2 gallons of seawater for 1 gallon of finally processed freshwater). This impingement highly alters the surroundings of the intake, for an estimated loss of habitat of thousands of acres.
To limit those, indirect intake systems are to be preferred. It consists of usually an intake of water beneath the bottom through porous designed layers. This way, the water flux is shared on a high surface and the particles are naturally filtered through the sand layer.

Neodren® indirect seawater intake, from www.catalanadeperforacions.com
Conclusion
Through its vast potentiality, desalination is one of the solution to tackle the growing human pressure on freshwater along the shores. Although China did not put high interest on desalination at first, the country is now amongst the biggest investors with Middle-East and the US. On top of that, China shows relevant renewables-desalination combination possibilities in order to mitigate the carbon impact of implementing desalination at large scale. Still, some environmental impacts need to be investigated further along with plants localization. Under those conditions, China has all the assets to solve one of its biggest concern, its population, freshwater supply.
Sources
-
Kamal Mohammedi, Anissa Talamali, Youcef Smaili, Imane Saadoun, Aomar Ait-Aider. Environmental Impact of Seawater Desalination Plants: Case Study in Algeria. American Journal of Environmental Protection. Vol. 2, No. 6, 2013, pp. 141-148
-
Ibrahim S. Al-Mutaz (1989), Environmental Impact Of Seawater Desalination Plants
-
Danoun (2007), Desalination Plants: Potential impacts of brine discharge on marine life
-
Palomar and Losada (2011), Impacts of Brine Discharge on the Marine Environment. Modelling as a Predictive Tool. Desalination, Trends and Technologies (pp 279-310)
-
Cooley, Ajami and Heberger (2013), Key Issues in Seawater Desalination in California – Marine Impacts. Pacific Institute.
-
Neuparth. F. Costa. O and Costa. M.H. (2002).Effects of temperature and salinity on life history of the marine Amphipod GammarusLocusta.Implications for ecological testing. Ecotoxicology 11, pp 61-73.
-
Abdul-Wahab.S. (2007).Characterization of water discharge from two thermal power/ desalination plants in Oman. Environmental Engineering Science 24 3, pp 321-337.
-
Jenkins, S.A and Wasyl, J. (2005). Oceanographic Consideration for Desalination plants in Southern California Coastal Waters. Scripps Institution of Oceanography Technical Report No. 54. Marine Physical Laboratory, University of California, San Diego
-
Hiscock, K., Southward, A.J., Tittley, I. & Hawkins, S.J. (2004).Effect of changing temperature on benthic marine life in Britain and Ireland. Aquatic Conservation 14, 333-362.
-
Voutchkov, N. (2011). “Overview of Seawater Concentrate Disposal Alternatives.” Journal of Desalination 273: 205-219.
-
National Research Council (NRC). (2008). Desalination: A National Perspective. Washington, D.C.: National Academies Press, 312 p.
-
Cooley, H., P. Gleick, and G. Wolff (2006). Desalination with a Grain of Salt: A California Perspective. Oakland, CA: Pacific Institute.
-
Feitelson E, Jones A. Global diffusion of XL-capacity seawater desalination[J]. Water Policy, 2014,16(6):1031-1053.
-
Shangbao Y. Progress and Prospect of Seawater Desalination in China (in Chinese)[J]. Technology of Water Treatment, 2014,40(12):1-4.
-
Zhou Y, Tol R. Implications of desalination for water resources in China - an economic perspective[J]. DESALINATION, 2004,164(PII S0011-9164(04)00191-23):225-240.
-
Zheng X, Chen D, Wang Q, et al. Seawater desalination in China: Retrospect and prospect[J]. CHEMICAL ENGINEERING JOURNAL, 2014,242:404-413.
-
China S O A P. Report on Seawater Utilization of China (in Chinese)[R].2014.
-
Chen T, Wang Q, Qin Y, et al. Knowledge, Attitudes and Practice of Desalinated Water among Professionals in Health and Water Departments in Shengsi, China: A Qualitative Study[J]. PLOS ONE, 2015,10(UNSP e01183604).
-
Cheng Jian L H X L. Current Situation of Seawater Desalination in China (in Chinese)[J]. Technology of Water Treatment, 2014,40(6):43-49.
-
Zhang L, Xie L, Chen H L, et al. Progress and prospects of seawater desalination in China[J]. DESALINATION, 2005,182(1-3):13-18.
-
Carter N T. Desalination and membrane technologies: federal research and adoption issues[J]. Congressional Research Service, 2013.
-
Feitelson E, Jones A. Global diffusion of XL-capacity seawater desalination[J]. Water Policy, 16 (2014) 1031–1053.
-
Charcosset C. A review of membrane processes and renewable energies for desalination[J]. Desalination, 2009, 245(1): 214-231.
-
Mathioulakis E, Belessiotis V, Delyannis E. Desalination by using alternative energy: Review and state-of-the-art[J]. Desalination, 2007, 203(1): 346-365.
-
El-Dessouky HT, Ettouney HM, Mandani F. International workshop for small and medium size plants with limited environmental impact Rome, 1998. Academia NazionaledelleScienzedetta Dei XL 1999;281–312.
-
Eltawil M A, Zhengming Z, Yuan L. A review of renewable energy technologies integrated with desalination systems[J]. Renewable and Sustainable Energy Reviews, 2009, 13(9): 2245-2262.
-
Voivontas D, Yannopoulos K, Rados K, et al. Market potential of renewable energy powered desalination systems in Greece[J]. Desalination, 1999, 121(2): 159-172.
-
Delyannis E, Belessiotis V. A historical overview of renewable energies. In: Proc. Mediterranean conference on renewable energy sources for water production, EURORED network, CRES, EDS; 1996. p. 13–7.